
Client: Mayar Gulf Engineering Consultants
Problem Description
In this study, the aerodynamic behavior of a truck and trailer is analyzed under two distinct configurations, referred to as Configuration 1 and Configuration 2. The simulation consists of both steady-state and unsteady-state analyses. Steady-state simulation is conducted at a constant speed of 80 km/h to evaluate overall aerodynamic forces, while the unsteady simulation captures transient flow characteristics and turbulence behavior.
The primary objective of this study is to quantify the differences in aerodynamic drag between the two configurations and assess the additional fuel consumption required to overcome this drag. To achieve this, Computational Fluid Dynamics (CFD) simulations are performed using the Ansys CFD software package. The client has provided detailed CAD models for both configurations, ensuring accurate geometric representation and reliable analysis.
Methodology
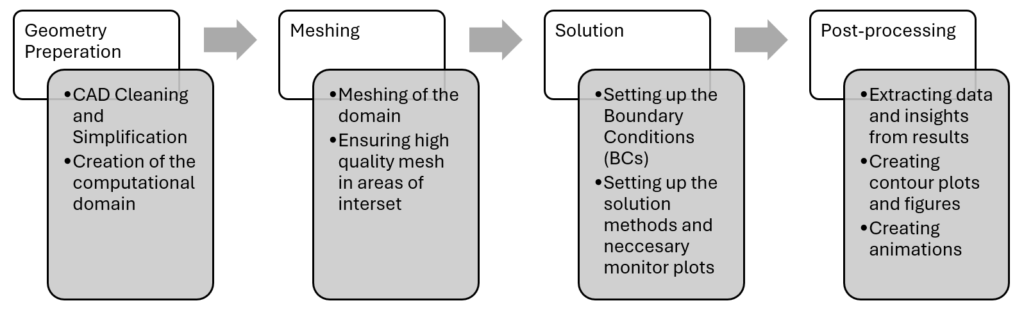
The following flowchart illustrates the structured simulation methodology adopted for this study, outlining the key stages involved in the analysis of the truck and semi-trailer configurations.
Tools Used
- Ansys Spaceclaim – Geometry Pre-processing
- Ansys Fluent Meshing – Watertight Meshing
- Ansys Fluent – Solution and Post-processing
Geometry Preparation
The following figures shows the original CAD geometry and the simplified and cleaned geometry.
Configuration 1
Configuration 2
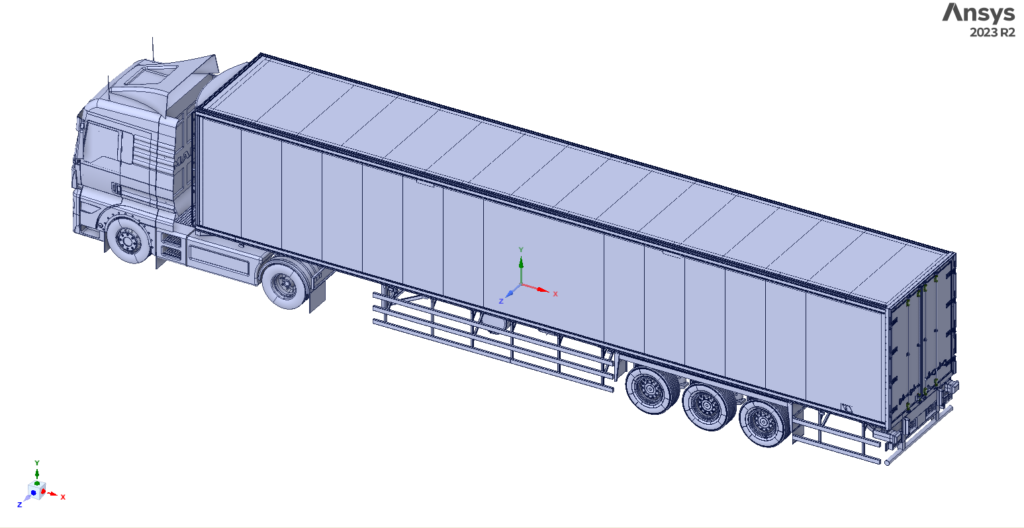
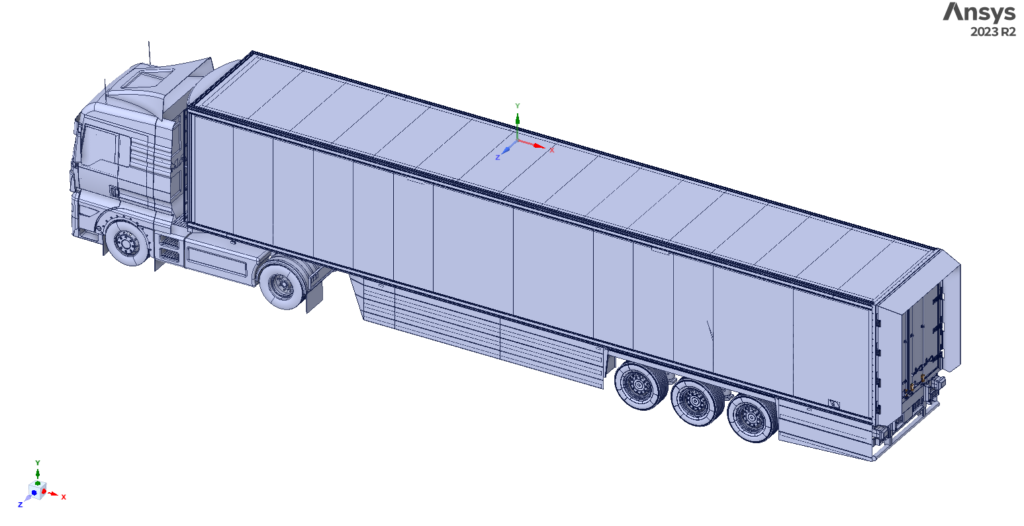

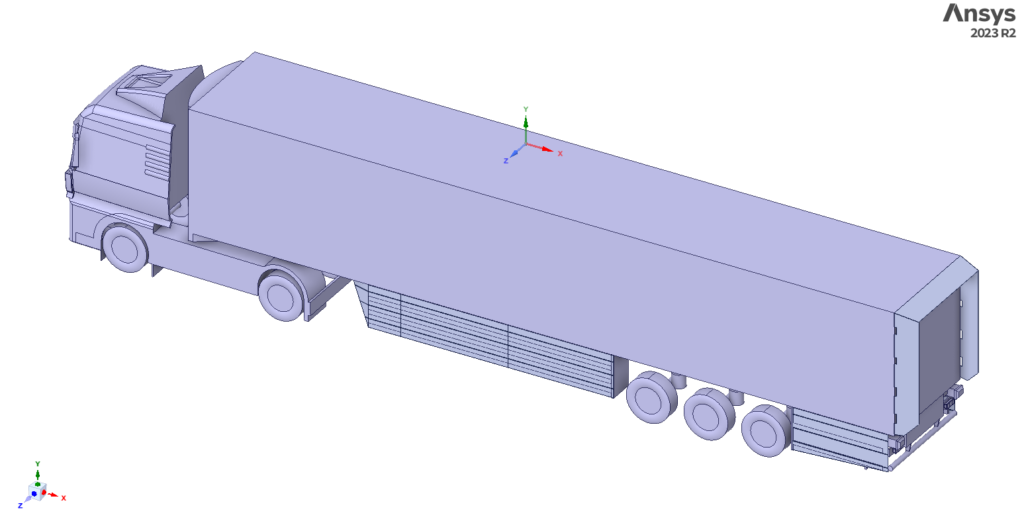
During the preprocessing stage, any potential geometric errors are identified and corrected to ensure a high-quality simulation. These errors may include interferences between different components, missing faces, or misaligned bodies. Each issue is carefully evaluated to determine its impact on the aerodynamic behavior—only errors that could significantly affect the simulation results are addressed, while minor, non-influential details may be omitted to optimize computational efficiency.
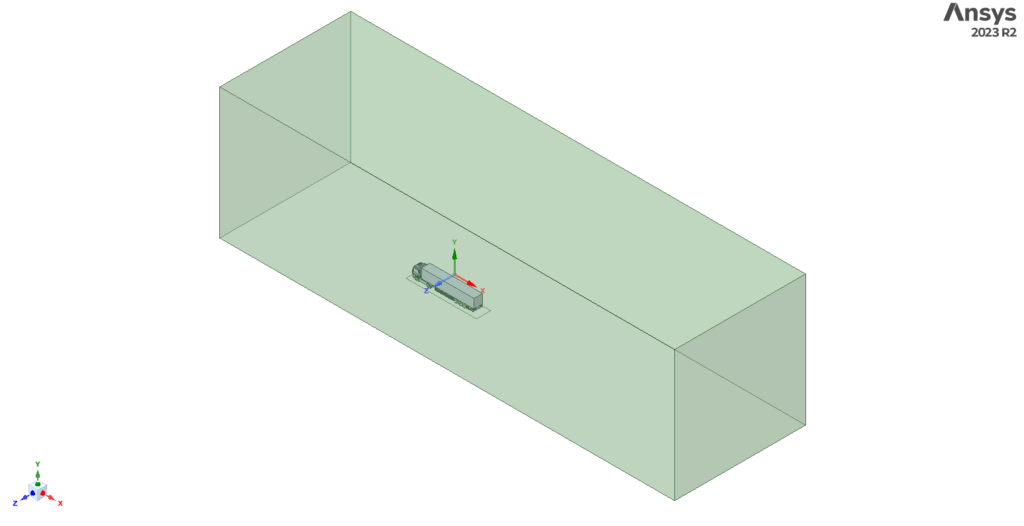
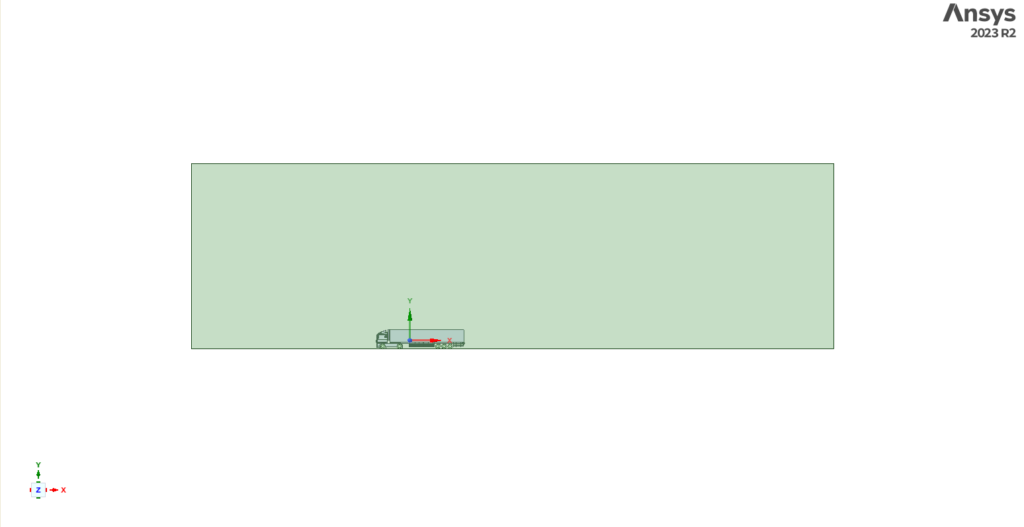
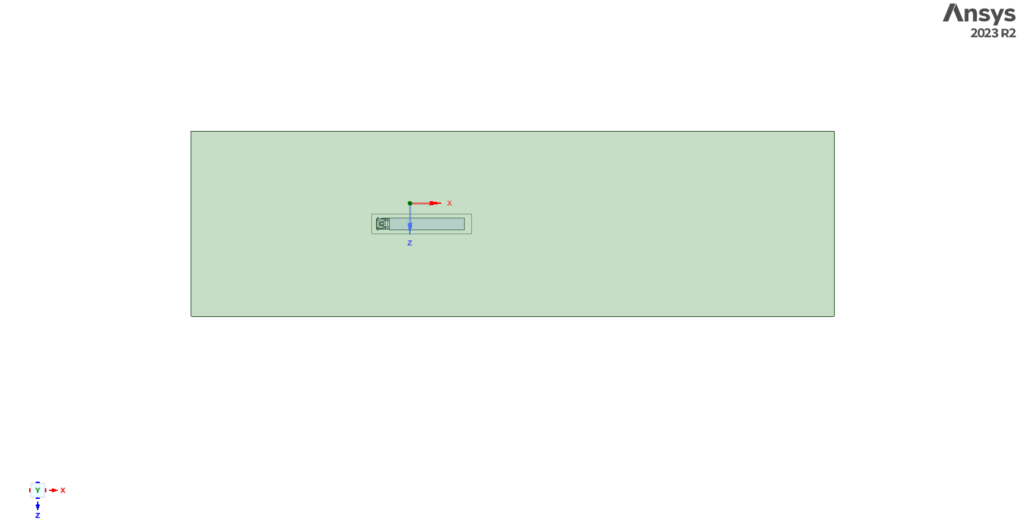
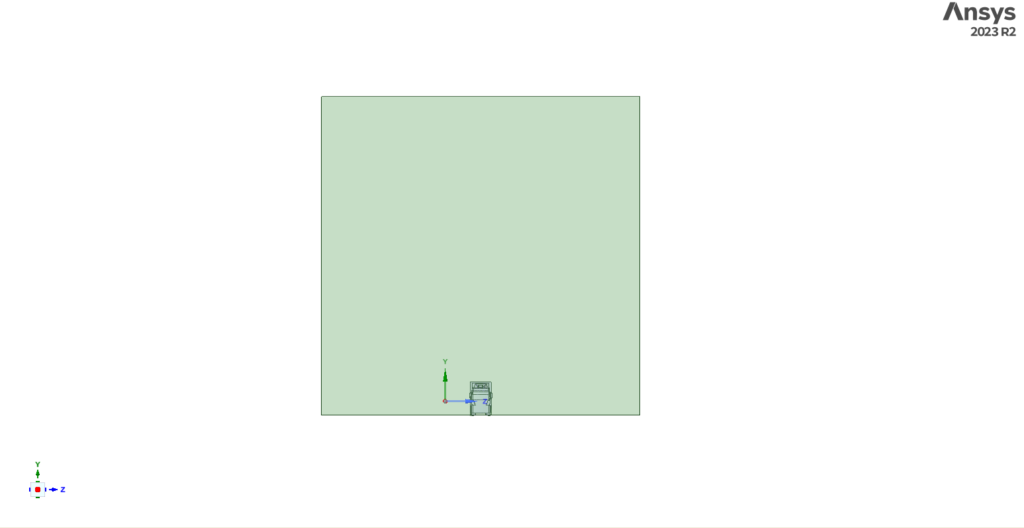
After cleaning and simplifying the models, the computational domain was created. The domain has the following dimensions:
| wdt_ID | wdt_created_by | wdt_created_at | wdt_last_edited_by | wdt_last_edited_at | Direction | Length |
|---|---|---|---|---|---|---|
| 1 | akamaleldin01@gmail.com | 13/05/2025 12:54 PM | akamaleldin01@gmail.com | 13/05/2025 12:54 PM | Upstream | 40 m |
| 2 | akamaleldin01@gmail.com | 13/05/2025 12:54 PM | akamaleldin01@gmail.com | 13/05/2025 12:54 PM | Downstream | 80 m |
| 3 | akamaleldin01@gmail.com | 13/05/2025 12:54 PM | akamaleldin01@gmail.com | 13/05/2025 12:54 PM | Height | 40 m |
| 4 | akamaleldin01@gmail.com | 13/05/2025 12:54 PM | akamaleldin01@gmail.com | 13/05/2025 12:54 PM | Side | 40 m |
The following figures shows the computational domain around the truck-trailer.
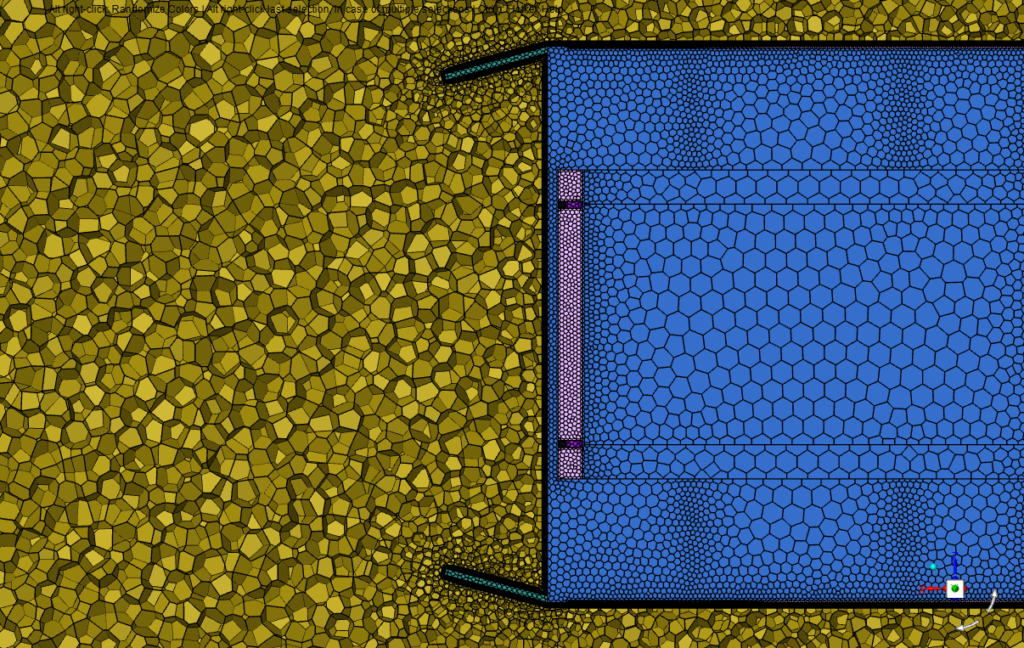
Mesh
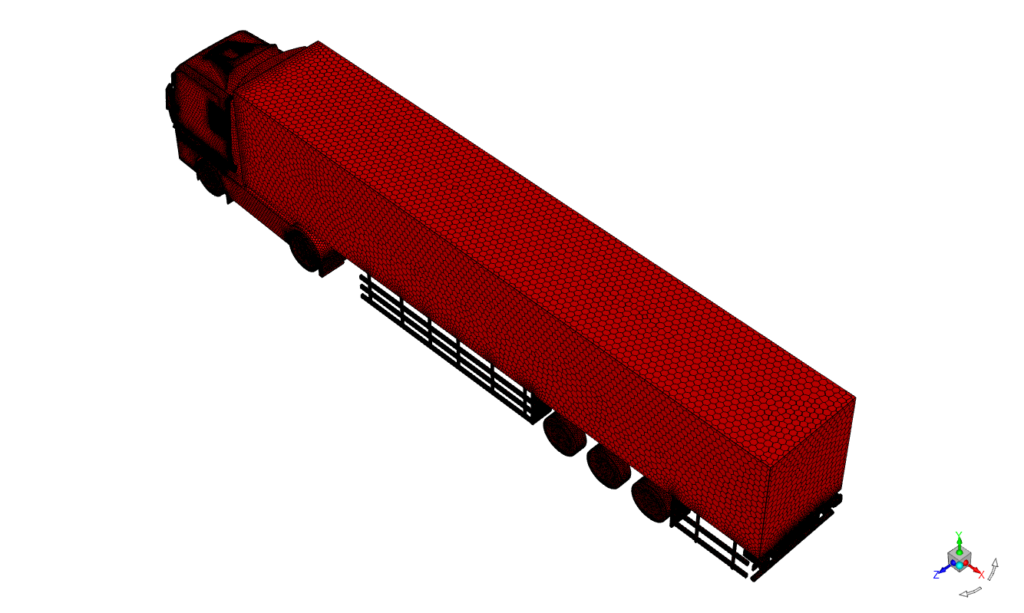
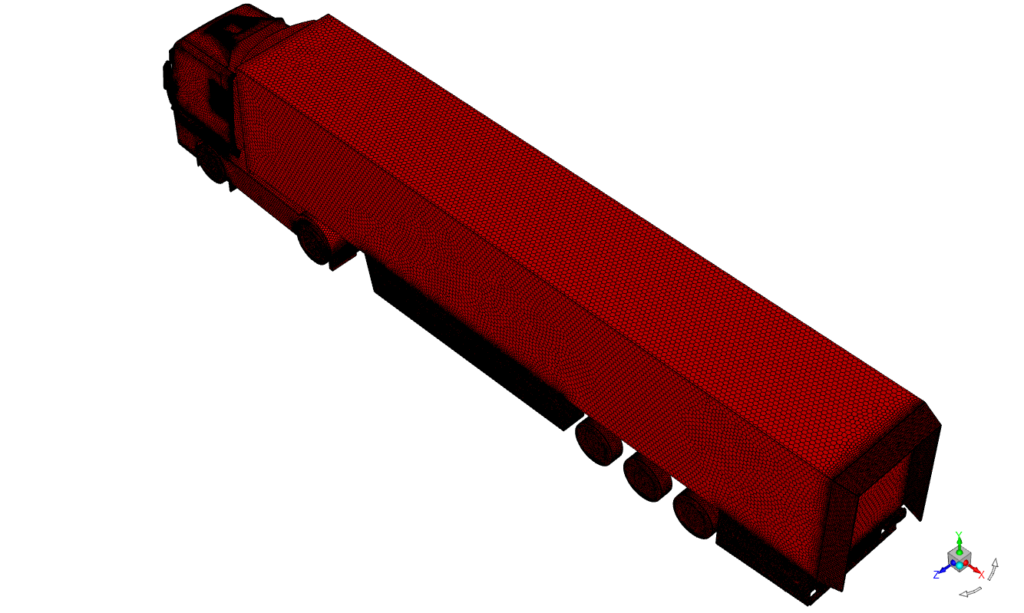
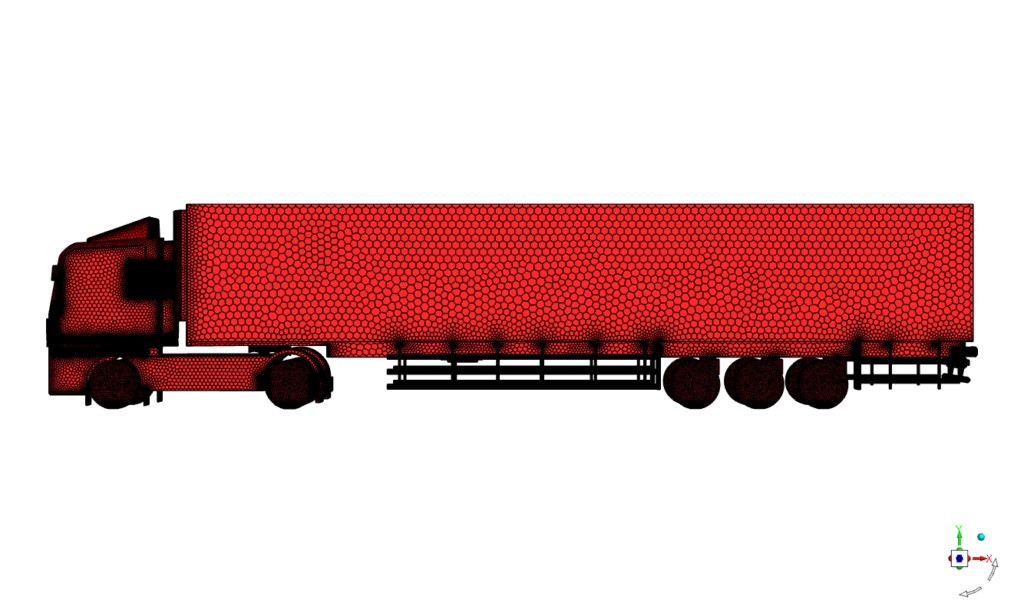
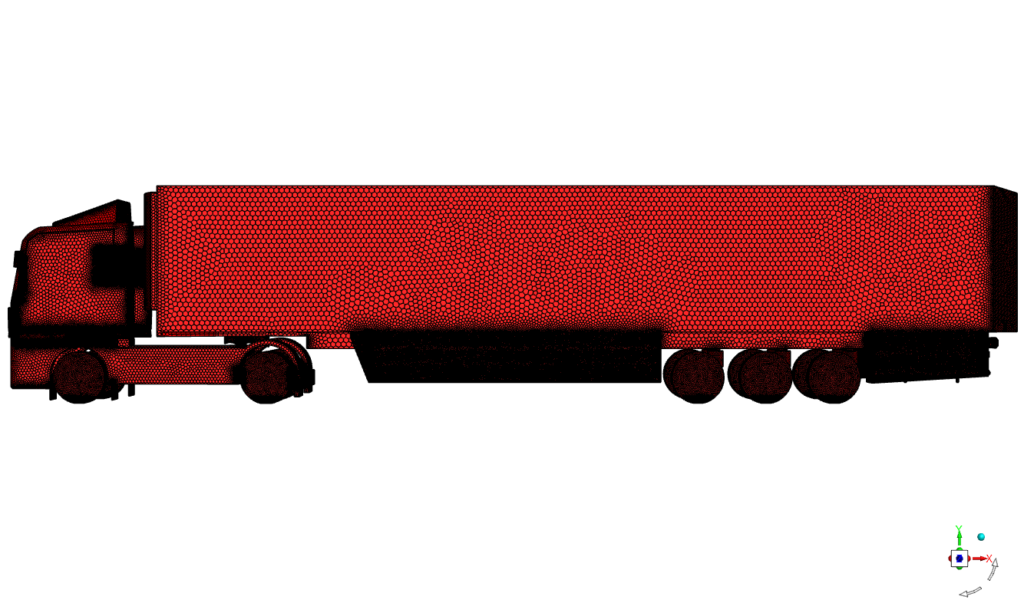
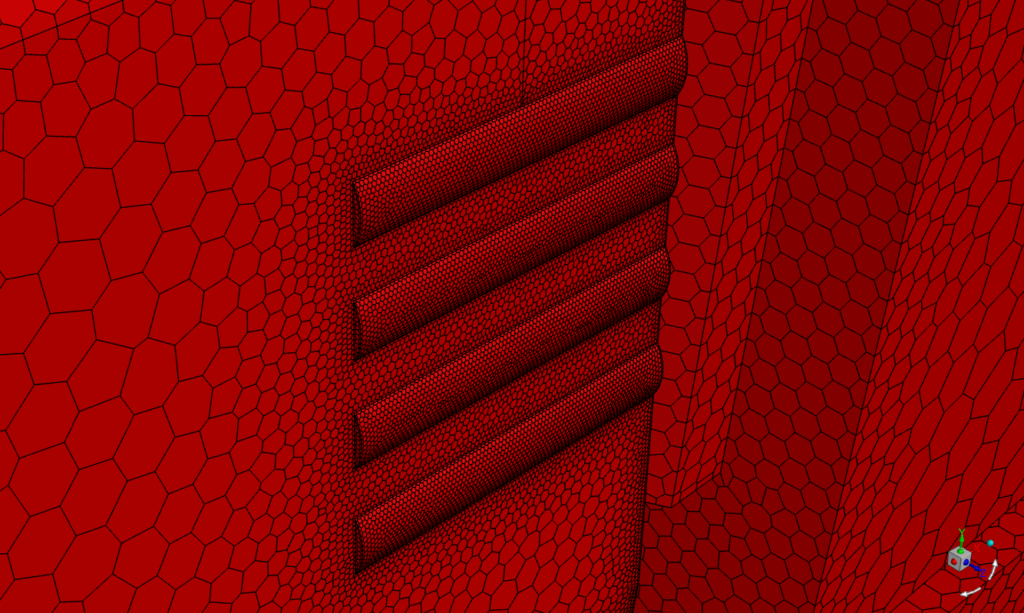
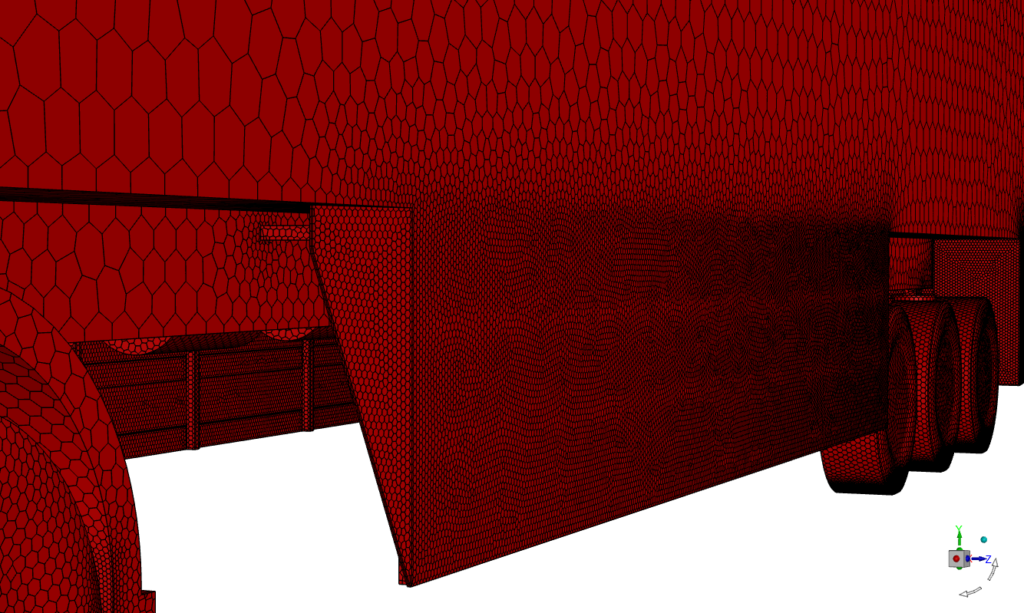
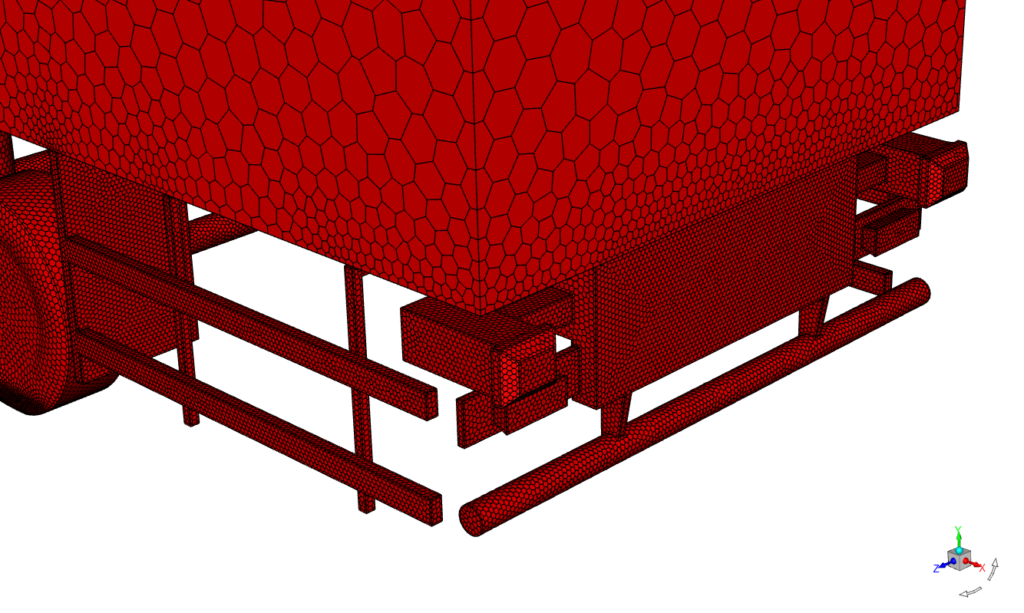
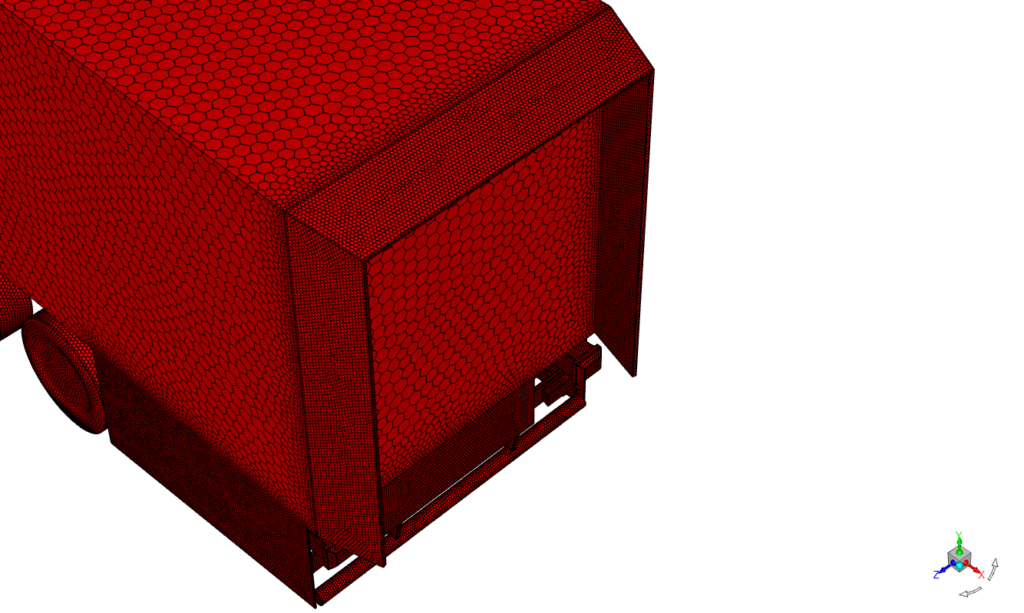
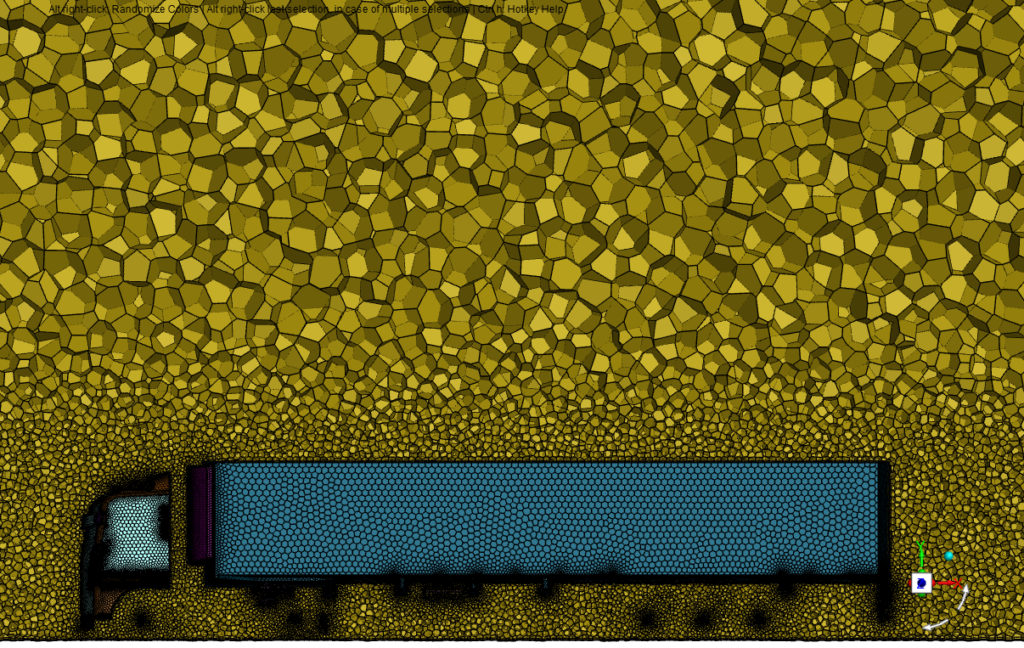
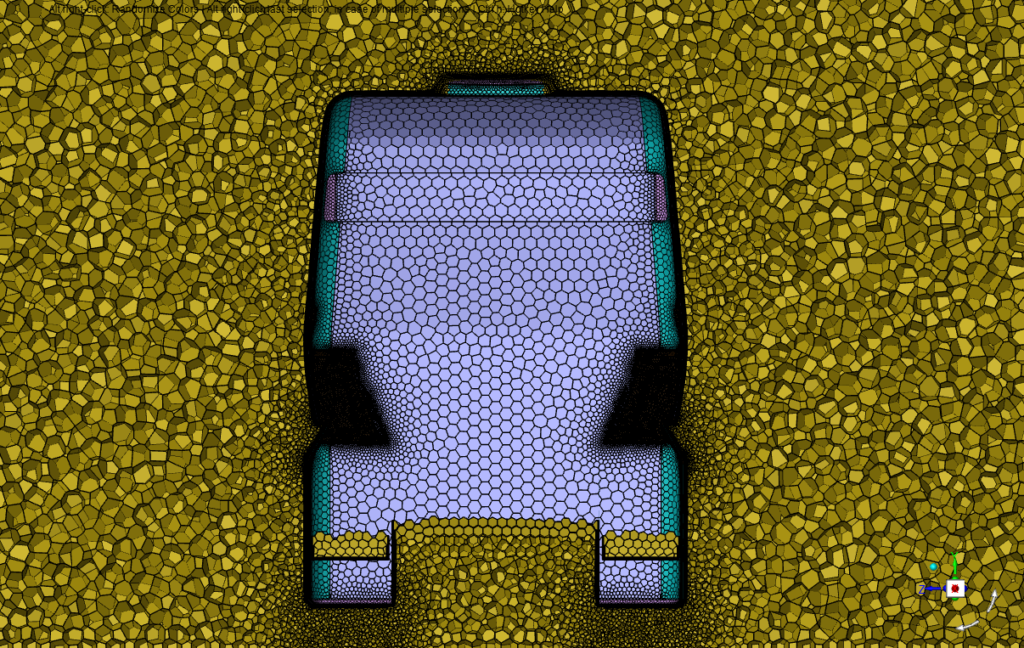
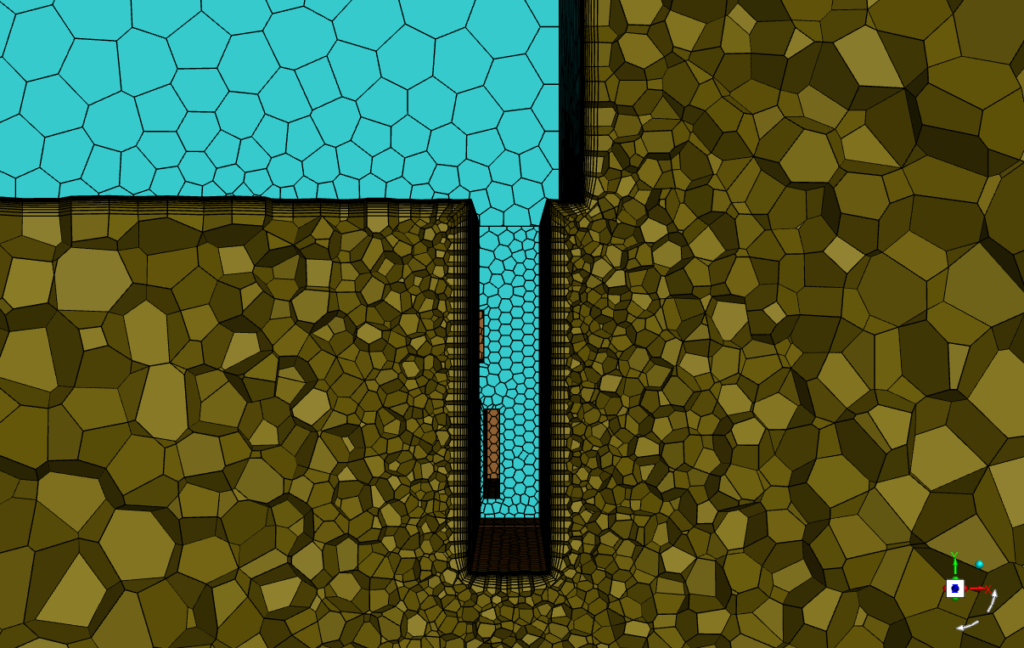
The following figures shows the surface and volume mesh around the truck-trailer.
Configuration 1
Configuration 2
The following tables summarizes the key features of the volume mesh around each configuration.
Configuration 1
Configuration 2
| wdt_ID | wdt_created_by | wdt_created_at | wdt_last_edited_by | wdt_last_edited_at | Feature | Value |
|---|---|---|---|---|---|---|
| 1 | akamaleldin01@gmail.com | 13/05/2025 01:08 PM | akamaleldin01@gmail.com | 13/05/2025 01:10 PM | Number of Elements | 7,225,436 |
| 2 | akamaleldin01@gmail.com | 13/05/2025 01:08 PM | akamaleldin01@gmail.com | 13/05/2025 01:10 PM | Number of Faces | 35,521,971 |
| 3 | akamaleldin01@gmail.com | 13/05/2025 01:08 PM | akamaleldin01@gmail.com | 13/05/2025 01:10 PM | Number of Nodes | 22,816,975 |
| 4 | akamaleldin01@gmail.com | 13/05/2025 01:08 PM | akamaleldin01@gmail.com | 13/05/2025 01:08 PM | Number of Layers | 10 |
| 5 | akamaleldin01@gmail.com | 13/05/2025 01:08 PM | akamaleldin01@gmail.com | 13/05/2025 01:09 PM | Minimum Orthogonality | 0.12 |
| 6 | akamaleldin01@gmail.com | 13/05/2025 01:08 PM | akamaleldin01@gmail.com | 13/05/2025 01:09 PM | Average Aspect Ratio | 49.24 |
| wdt_ID | wdt_created_by | wdt_created_at | wdt_last_edited_by | wdt_last_edited_at | Feature | Value |
|---|---|---|---|---|---|---|
| 1 | akamaleldin01@gmail.com | 13/05/2025 01:18 PM | akamaleldin01@gmail.com | 13/05/2025 01:19 PM | Number of Elements | 9,407,710 |
| 2 | akamaleldin01@gmail.com | 13/05/2025 01:18 PM | akamaleldin01@gmail.com | 13/05/2025 01:19 PM | Number of Faces | 48,261,372 |
| 3 | akamaleldin01@gmail.com | 13/05/2025 01:18 PM | akamaleldin01@gmail.com | 13/05/2025 01:19 PM | Number of Nodes | 32,200,214 |
| 4 | akamaleldin01@gmail.com | 13/05/2025 01:18 PM | akamaleldin01@gmail.com | 13/05/2025 01:18 PM | Number of Layers | 10 |
| 5 | akamaleldin01@gmail.com | 13/05/2025 01:18 PM | akamaleldin01@gmail.com | 13/05/2025 01:19 PM | Minimum Orthogonality | 0.15 |
| 6 | akamaleldin01@gmail.com | 13/05/2025 01:18 PM | akamaleldin01@gmail.com | 13/05/2025 01:18 PM | Average Aspect Ratio | 73.68 |
Results
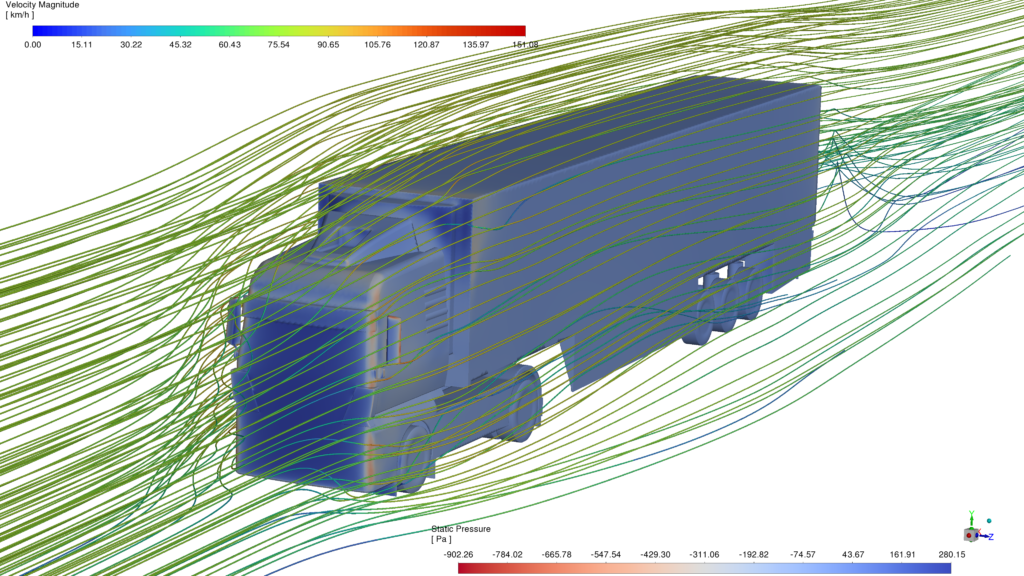
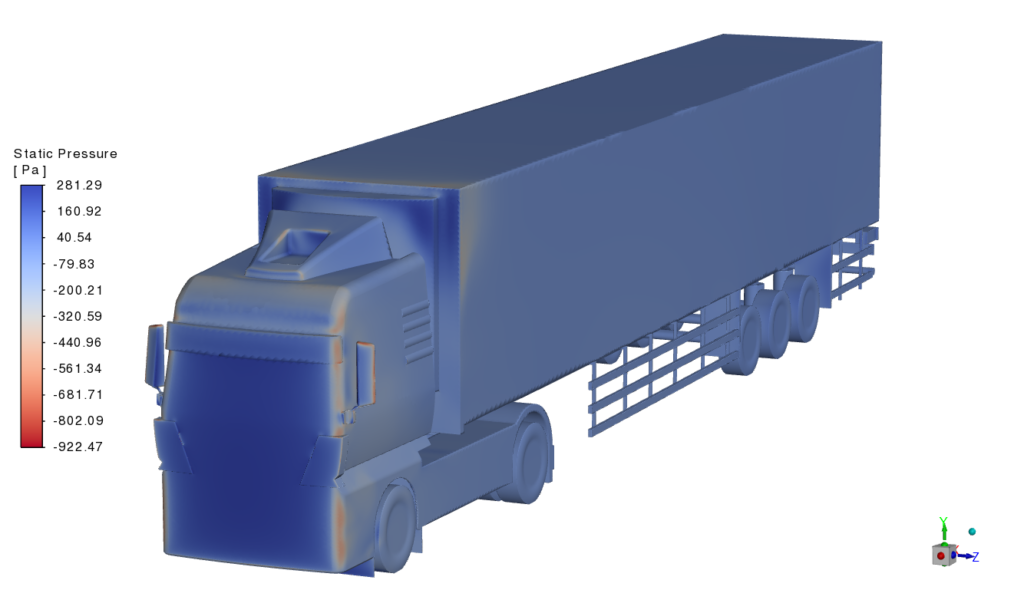
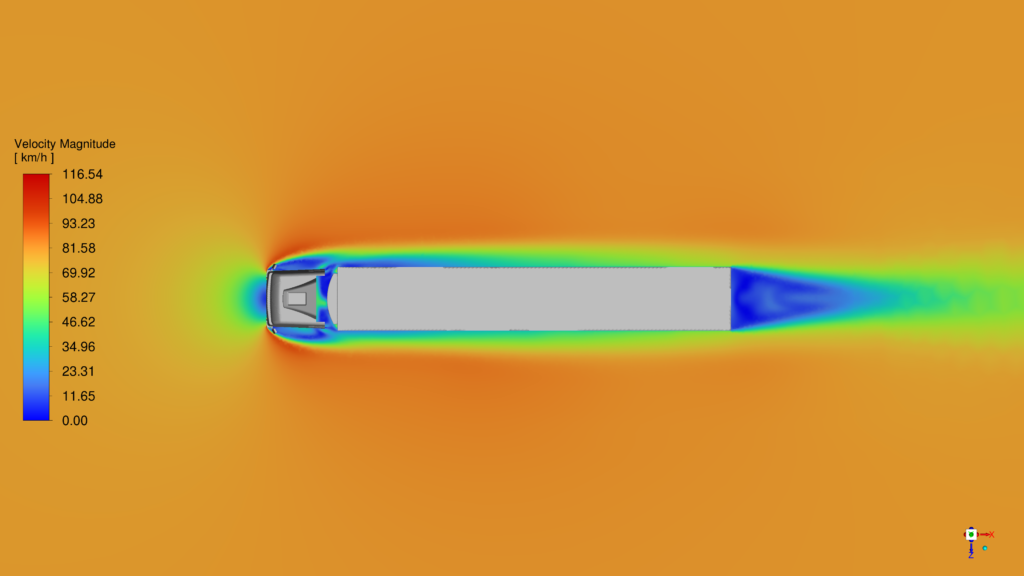
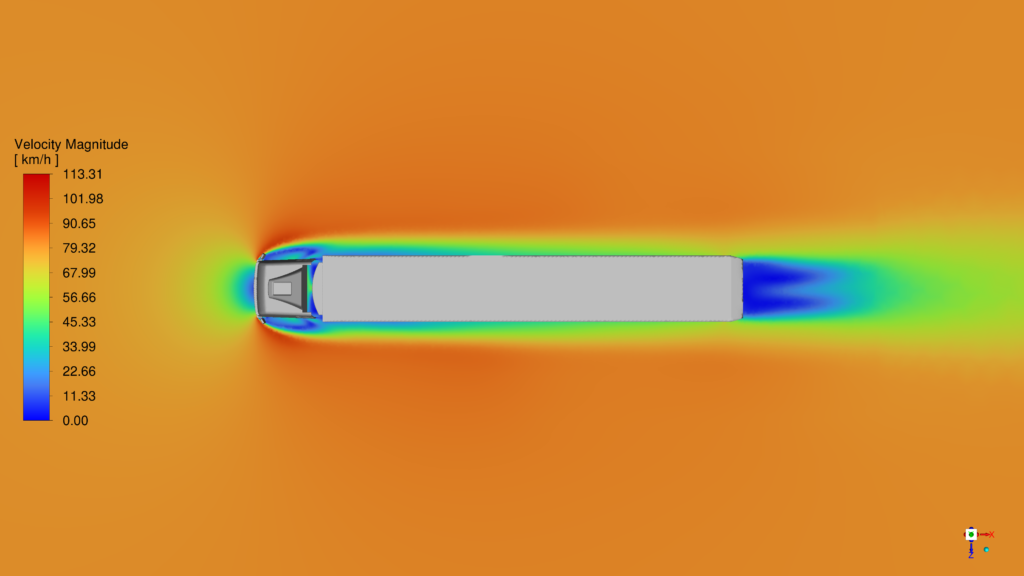
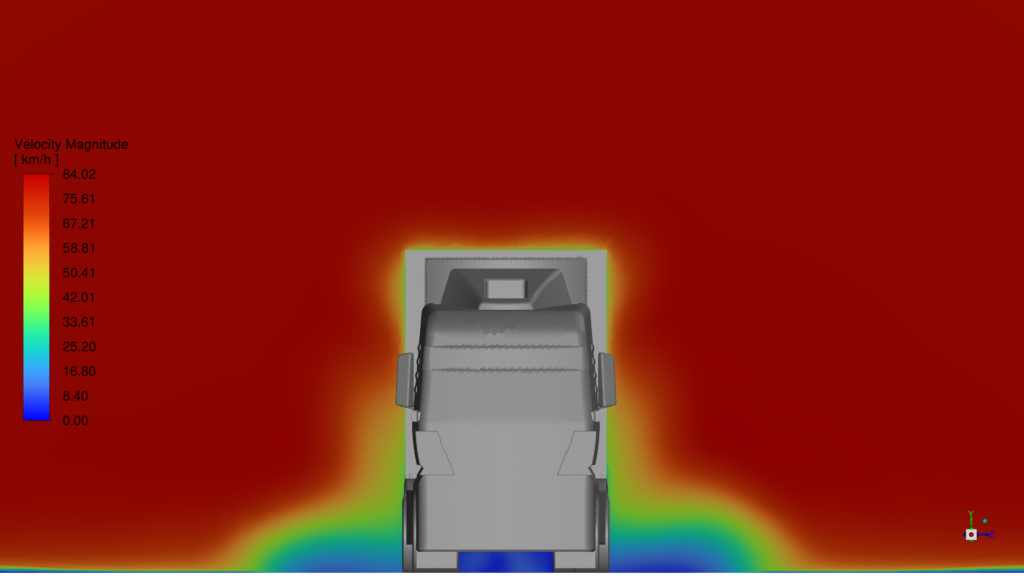
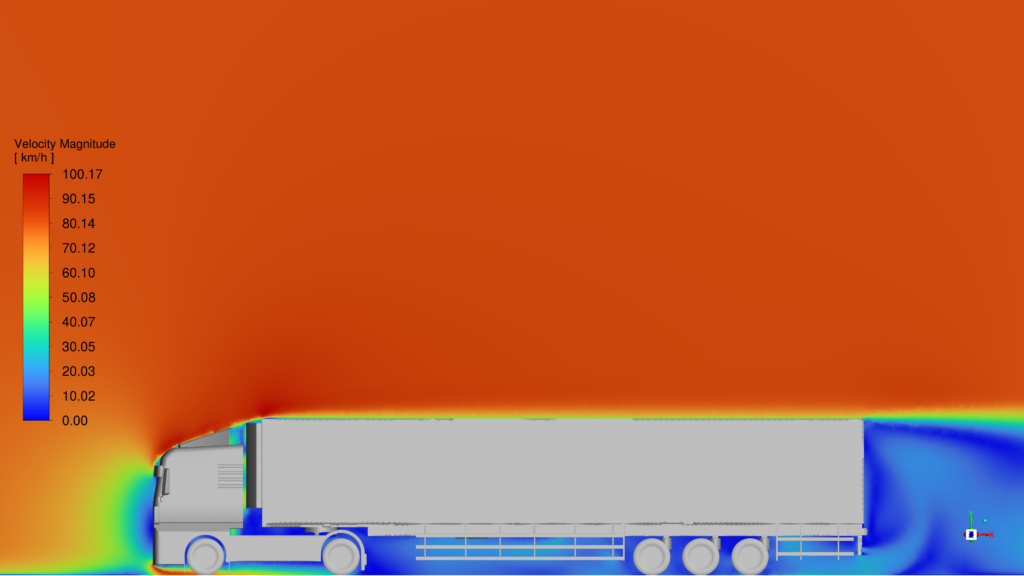
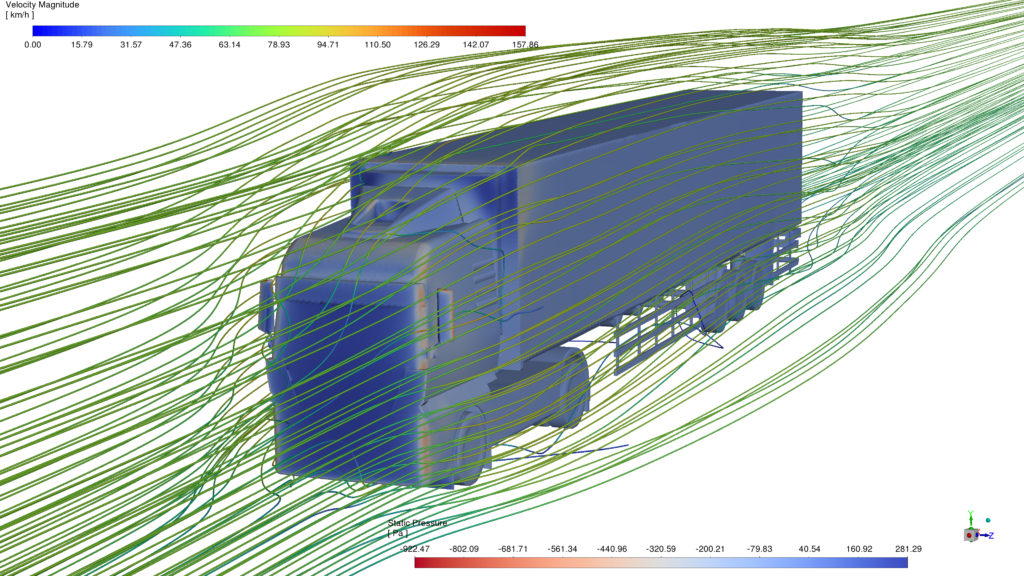
Contours and Streamlines
Configuration 1
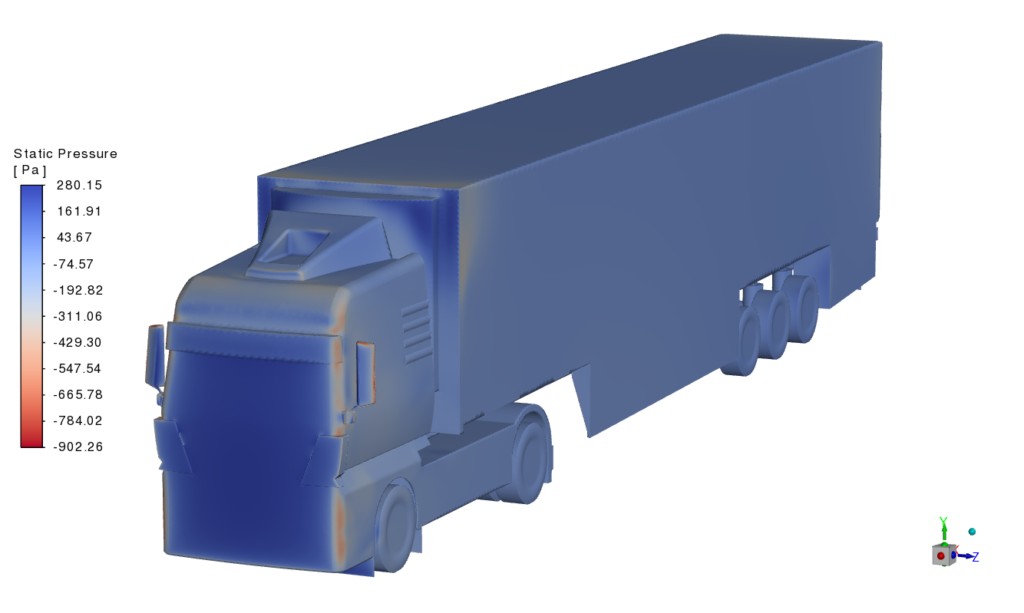
Configuration 2


Comparision
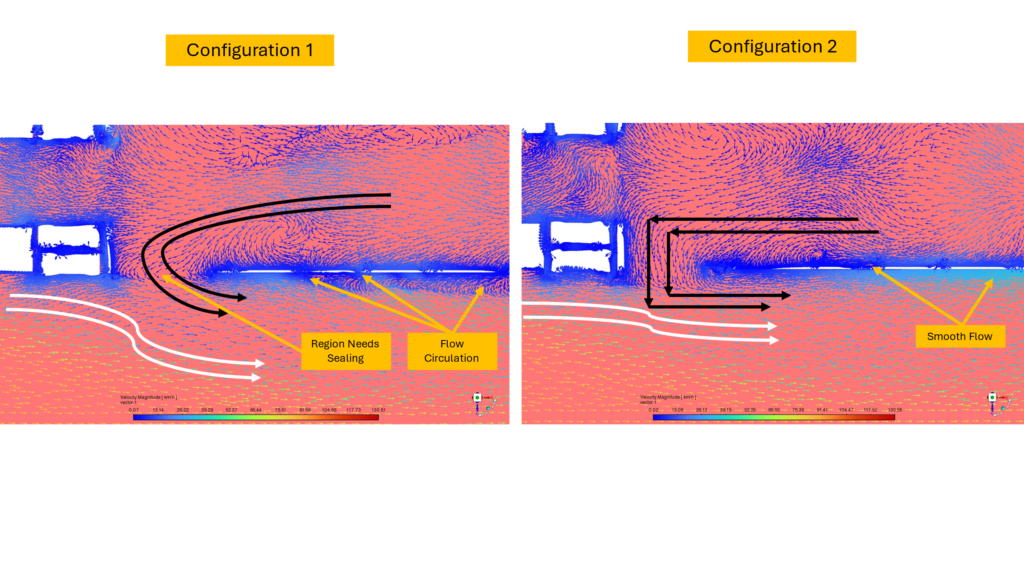
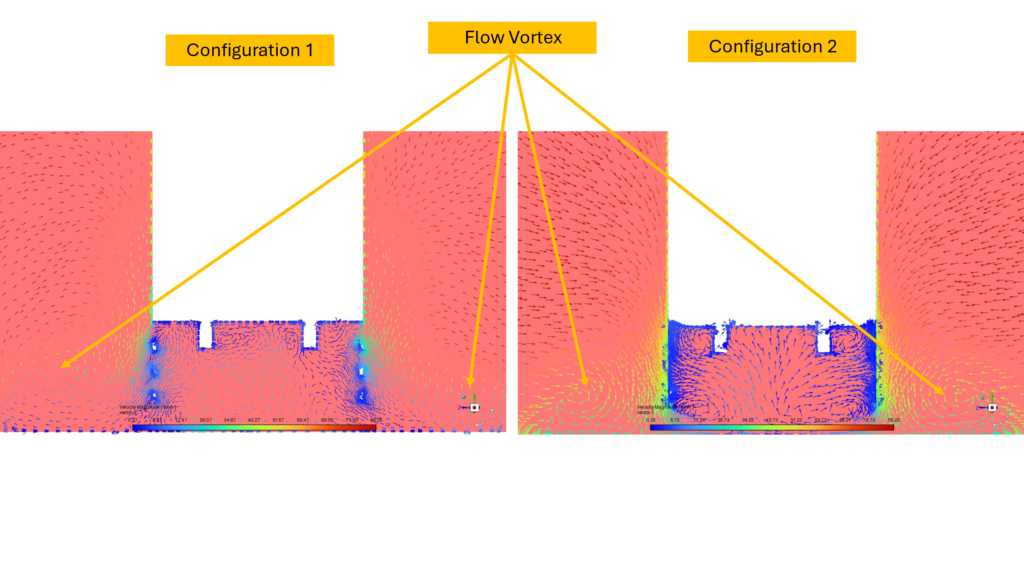
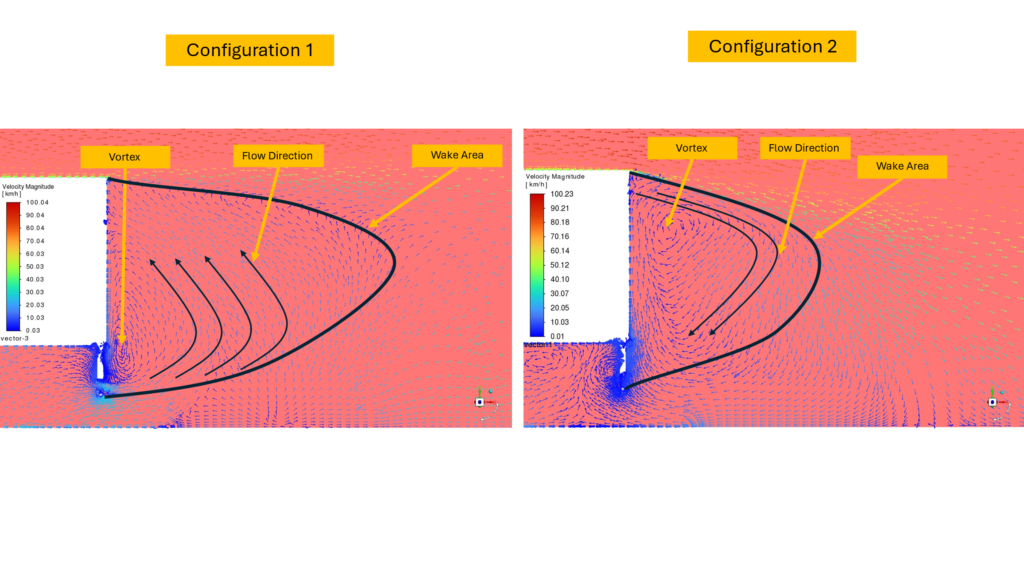
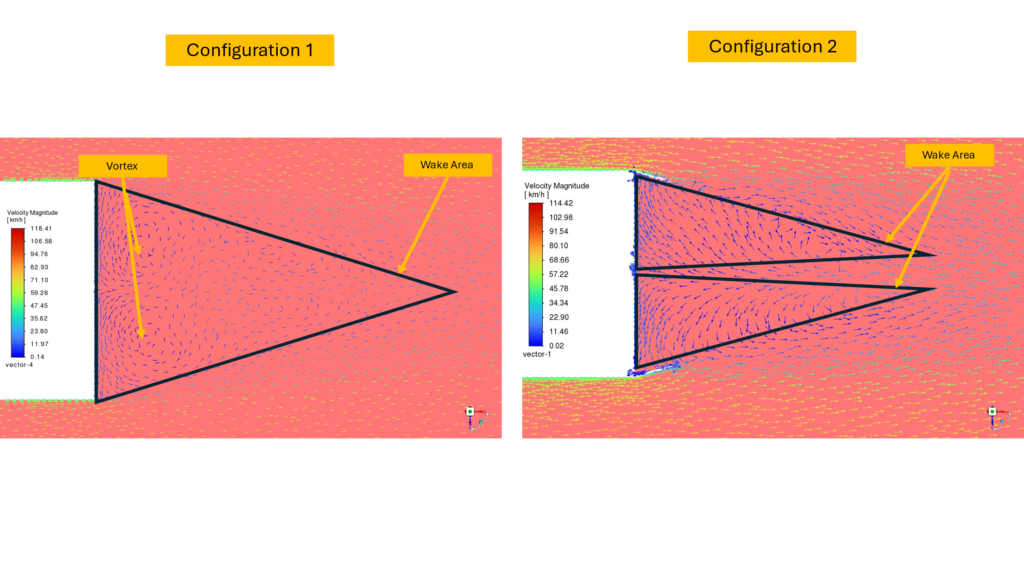
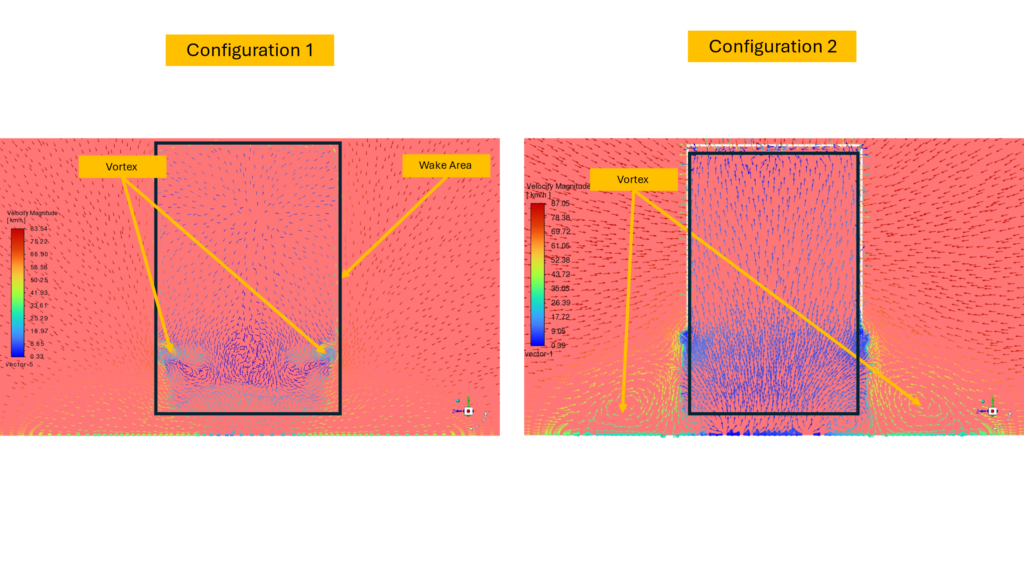
Configuration 2 exhibits smoother flow behavior near the trailer walls, a result of the combined effect of side skirts and back flaps. These aerodynamic devices help keep the flow attached to the trailer’s surface and reduce disturbances around the vehicle. Compared to Configuration 1, the flow remains closer to the trailer body, with vortical structures appearing more confined and better organized. This improvement is primarily due to the side skirts, which seal the underbody and prevent the upward intrusion of low-momentum air, and the back flaps, which help manage and direct the wake flow more effectively. Together, these modifications limit disruptive flow interactions and reduce large-scale separation. Across various sections downstream of the trailer, the wake in Configuration 2 appears more compact and less dispersed, with noticeably smaller recirculation zones. This indicates a cleaner and more controlled wake development. In summary, the integration of side skirts and back flaps in Configuration 2 significantly improves the vehicle’s aerodynamic performance by promoting flow coherence and minimizing drag-inducing flow separation. The following table summarizes the difference is aerodynamic quantities between both configurations.
| wdt_ID | wdt_created_by | wdt_created_at | wdt_last_edited_by | wdt_last_edited_at | Aero Quantity | Configuration 1 | Configuration 2 | Difference |
|---|---|---|---|---|---|---|---|---|
| 1 | akamaleldin01@gmail.com | 13/05/2025 01:23 PM | akamaleldin01@gmail.com | 13/05/2025 01:23 PM | Lift Force | -338.4949 N | -162.4696 N | -52% |
| 2 | akamaleldin01@gmail.com | 13/05/2025 01:23 PM | akamaleldin01@gmail.com | 13/05/2025 01:23 PM | Drag Force | 1722.0033 N | 1526.2015 N | -11.37% |
| 3 | akamaleldin01@gmail.com | 13/05/2025 01:23 PM | akamaleldin01@gmail.com | 13/05/2025 01:23 PM | Lift Coefficient | -0.11501966 | -0.055206736 | -52% |
| 4 | akamaleldin01@gmail.com | 13/05/2025 01:23 PM | akamaleldin01@gmail.com | 13/05/2025 01:23 PM | Drag Coefficient | 0.58513212 | 0.51859919 | -11.37% |
Starting with the Lift Force, Configuration 1 exhibits a substantially higher negative lift (-338.49 N) compared to Configuration 2 (-162.47 N), corresponding to a 52% reduction. In automotive aerodynamics, a negative lift value generally indicates increased downforce, which can improve vehicle stability at high speeds. However, excessive downforce may also lead to increased rolling resistance and energy consumption. The reduction in lift in Configuration 2 suggests a more balanced pressure distribution over the vehicle’s surfaces, potentially due to design modifications such as smoother flow separation or reduced vortex formation near the roof or underbody.
Looking at the Drag Force, Configuration 2 shows a notable improvement, with a reduction from 1722.00 N to 1526.20 N, translating to an 11.37% decrease. Since drag force directly impacts fuel consumption and operational efficiency, this reduction signifies a meaningful aerodynamic enhancement. The drop in drag is further corroborated by the Drag Coefficient (Cd) values, which decreased from 0.5851 to 0.5186. A lower Cd reflects improved streamlining and less turbulent wake formation behind the trailer, possibly achieved through modifications such as fairings, underbody treatment, or optimized rear-end geometry.
Similarly, the Lift Coefficient (Cl) saw a 52% reduction, aligning with the observed change in lift force. This substantial decline implies that Configuration 2 minimizes unbalanced vertical forces acting on the vehicle, which could enhance overall handling and reduce oscillations due to aerodynamic lift at higher speeds.
Animations
The following animations shows the velocity contour around configuration 1 and 2 respectively.
Conclusion
The previous figures and animations illustrate the positive aerodynamic impact of the refined design and affirms the value of implementing passive flow control devices. Elements such as side skirts, fairings, and rear-end tapering have proven effective in reducing flow separation, tightening the wake, and ultimately lowering the drag coefficient, leading to enhanced fuel efficiency and operational performance.
The aerodynamic improvements from Configuration 1 to Configuration 2 result in an estimated fuel consumption reduction of approximately 1.3 L/100 km, equating to about a 4.5% improvement in fuel efficiency. This aligns with reported fuel savings from aerodynamic enhancements in heavy-duty trucks.